CoronaVirus Exploratory Data Analysis
In this post we are going to see how to apply EDA in live problems. For that we taken the coronavirus data set from kaggle and going to apply EDA . This post will help the beginners to learn how to apply EDA in data science field.
What is Coronavirus
2019 Novel Coronavirus (2019-nCoV) is a virus (more specifically, a coronavirus) identified as the cause of an outbreak of respiratory illness first detected in Wuhan, China. Early on, many of the patients in the outbreak in Wuhan, China reportedly had some link to a large seafood and animal market, suggesting animal-to-person spread. However, a growing number of patients reportedly have not had exposure to animal markets, indicating person-to-person spread is occurring. At this time, it’s unclear how easily or sustainably this virus is spreading between people - CDC
This dataset has daily level information on the number of affected cases, deaths and recovery from 2019 novel coronavirus.
The data is available from 22 Jan 2020.
This dataset has daily level information on the number of affected cases, deaths and recovery from 2019 novel coronavirus.
The data is available from 22 Jan 2020.
Define the Problem
Coronaviruses are a large family of viruses that are common in many different species of animals, including camels, cattle, cats, and bats. Rarely, animal coronaviruses can infect people and then spread between people such as with MERS, SARS, and now with 2019-nCoV.
Outbreaks of novel virus infections among people are always of public health concern. The risk from these outbreaks depends on characteristics of the virus, including whether and how well it spreads between people, the severity of resulting illness, and the medical or other measures available to control the impact of the virus (for example, vaccine or treatment medications).
This is a very serious public health threat. The fact that this virus has caused severe illness and sustained person-to-person spread in China is concerning, but it’s unclear how the situation in the United States will unfold at this time.
The risk to individuals is dependent on exposure. At this time, some people will have an increased risk of infection, for example healthcare workers caring for 2019-nCoV patients and other close contacts. For the general American public, who are unlikely to be exposed to this virus, the immediate health risk from 2019-nCoV is considered low. The goal of the ongoing U.S. public health response is to prevent sustained spread of 2019-nCov in this country.
Precautions
Health authorities and scientists say the same precautions against other viral illnesses can be used: wash your hands frequently, cover up your coughs, try not to touch your face. And anyone who does come down with the virus should be placed in isolation. "Considering that substantial numbers of patients with SARS and MERS were infected in health-care settings", precautions need to be taken to prevent that happening again, the Chinese team warned in The Lancet.
Coronavirus Exploratory Data Analysis
We can explore the analysis of the corona virus affected stats
%matplotlib inline
import matplotlib.pyplot as plt
import pandas as pd
import numpy as np
1 2 | nCov_df = pd.read_csv('2019_nCoV_data.csv') nCov_df.columns |
The output is
Index(['Sno', 'Date', 'Province/State', 'Country', 'Last Update', 'Confirmed',
       'Deaths', 'Recovered'],
      dtype='object')
Column Description
- Sno - Serial number
- Date - Date and time of the observation in MM/DD/YYYY HH:MM:SS
- Province / State - Province or state of the observation (Could be empty when missing)
- Country - Country of observation
- Last Update - Time in UTC at which the row is updated for the given province or country. (Not standardised currently. So please clean them before using it)
- Confirmed - Number of confirmed cases
- Deaths - Number of deaths
- Recovered - Number of recovered cases
The sample data are given below,
nCov_df.head()
the output is given below,
 Sno Date Province/State Country Last Update Confirmed Deaths Recovered
0 1 01/22/2020 12:00:00 Anhui China 01/22/2020 12:00:00 1.0 0.0 0.0
1 2 01/22/2020 12:00:00 Beijing China 01/22/2020 12:00:00 14.0 0.0 0.0
2 3 01/22/2020 12:00:00 Chongqing China 01/22/2020 12:00:00 6.0 0.0 0.0
3 4 01/22/2020 12:00:00 Fujian China 01/22/2020 12:00:00 1.0 0.0 0.0
4 5 01/22/2020 12:00:00 Gansu China 01/22/2020 12:00:00 0.0 0.0 0.0
nCov_df.info()

the output is,
<class 'pandas.core.frame.DataFrame'>
RangeIndex: 1199 entries, 0 to 1198
Data columns (total 8 columns):
Sno               1199 non-null int64
Date              1199 non-null object
Province/State    888 non-null object
Country           1199 non-null object
Last Update       1199 non-null object
Confirmed         1199 non-null float64
Deaths            1199 non-null float64
Recovered         1199 non-null float64
dtypes: float64(3), int64(1), object(4)
memory usage: 75.0+ KB
Based on the above information ,The Province/State having some missing values
nCov_df.describe()

the output is,

 Sno Confirmed Deaths Recovered
count 1199.000000 1199.000000 1199.000000 1199.000000
mean 600.000000 276.213511 5.961635 14.617181
std 346.265794 1966.264622 58.082724 103.959136
min 1.000000 0.000000 0.000000 0.000000
25% 300.500000 2.000000 0.000000 0.000000
50% 600.000000 10.000000 0.000000 0.000000
75% 899.500000 82.000000 0.000000 2.000000
max 1199.000000 31728.000000 974.000000 2222.000000
nCov_df[['Confirmed', 'Deaths', 'Recovered']].sum().plot(kind='bar')
The out put of the above line is ,

Observations
- The data set is contains many countries like China, Japan, US, India and so on.
- The comparison of confirmed with Recovered, It clearly states that the recovery action from virus is dead slow.
- The data clearly indicating the spread of virus
Data Clean up
Removing the unwanted columns from the data
nCov_df.drop(['Sno', 'Last Update'], axis=1, inplace=True)
nCov_df.columns

The result is

Index(['Date', 'Province/State', 'Country', 'Confirmed', 'Deaths',
       'Recovered'],
      dtype='object')
Converted the date data type object into datetime
nCov_df['Date'] = nCov_df['Date'].apply(pd.to_datetime)
nCov_df['Date'].head()

The result is

0   2020-01-22 12:00:00
1   2020-01-22 12:00:00
2   2020-01-22 12:00:00
3   2020-01-22 12:00:00
4   2020-01-22 12:00:00
Name: Date, dtype: datetime64[ns]
Replacing the wrongly mapped country value towards states
nCov_df[nCov_df['Province/State'] == 'Taiwan']['Country'] = 'Taiwan'
nCov_df[nCov_df['Province/State'] == 'Hong Kong']['Country'] = 'Hong Kong'
nCov_df.replace({'Country': 'Mainland China'}, 'China', inplace=True)
Listing all the countries which is affected with corona virus
nCov_df['Country'].unique()

The result is

array(['China', 'US', 'Japan', 'Thailand', 'South Korea',
       'Mainland China', 'Hong Kong', 'Macau', 'Taiwan', 'Singapore',
       'Philippines', 'Malaysia', 'Vietnam', 'Australia', 'Mexico',
       'Brazil', 'France', 'Nepal', 'Canada', 'Cambodia', 'Sri Lanka',
       'Ivory Coast', 'Germany', 'Finland', 'United Arab Emirates',
       'India', 'Italy', 'Sweden', 'Russia', 'Spain', 'UK', 'Belgium',
       'Others'], dtype=object)
Country based virus affected people information
nCov_df.groupby(['Country']).Confirmed.count().reset_index().sort_values(['Country'], ascending = True)

The output is,

 Country Confirmed
0 Australia 56
1 Belgium 7
2 Brazil 1
3 Cambodia 15
4 Canada 38
5 China 618
6 Finland 13
7 France 18
8 Germany 15
9 Hong Kong 19
10 India 12
11 Italy 12
12 Ivory Coast 1
13 Japan 20
14 Macau 19
15 Malaysia 18
16 Mexico 1
17 Nepal 17
18 Others 4
19 Philippines 13
20 Russia 11
21 Singapore 19
22 South Korea 20
23 Spain 11
24 Sri Lanka 15
25 Sweden 11
26 Taiwan 19
27 Thailand 20
28 UK 11
29 US 113
30 United Arab Emirates 13
31 Vietnam 19
Top most Severely affected countries
nCov_df.groupby(['Country']).Confirmed.count().reset_index().sort_values(['Confirmed'], ascending=False).head(10)


The output is,

 Country Confirmed
5 China 618
29 US 113
0 Australia 56
4 Canada 38
13 Japan 20
27 Thailand 20
22 South Korea 20
26 Taiwan 19
21 Singapore 19
14 Macau 19
List all the Provinces/States that were affected with Virus
nCov_df['Province/State'].unique()

The output is

array(['Anhui', 'Beijing', 'Chongqing', 'Fujian', 'Gansu', 'Guangdong',
       'Guangxi', 'Guizhou', 'Hainan', 'Hebei', 'Heilongjiang', 'Henan',
       'Hong Kong', 'Hubei', 'Hunan', 'Inner Mongolia', 'Jiangsu',
       'Jiangxi', 'Jilin', 'Liaoning', 'Macau', 'Ningxia', 'Qinghai',
       'Shaanxi', 'Shandong', 'Shanghai', 'Shanxi', 'Sichuan', 'Taiwan',
       'Tianjin', 'Tibet', 'Washington', 'Xinjiang', 'Yunnan', 'Zhejiang',
       nan, 'Chicago', 'Illinois', 'California', 'Arizona', 'Ontario',
       'New South Wales', 'Victoria', 'Bavaria', 'British Columbia',
       'Queensland', 'Chicago, IL', 'South Australia', 'Boston, MA',
       'Los Angeles, CA', 'Orange, CA', 'Santa Clara, CA', 'Seattle, WA',
       'Tempe, AZ', 'Toronto, ON', 'San Benito, CA', 'London, ON',
       'Madison, WI', 'Cruise Ship', 'Diamond Princess cruise ship'],
      dtype=object)
Impact in india
nCov_df[nCov_df.Country == 'India']

The output is,

 Date Province/State Country Confirmed Deaths Recovered
432 2020-01-30 21:30:00 NaN India 1.0 0.0 0.0
491 2020-01-31 19:00:00 NaN India 1.0 0.0 0.0
552 2020-02-01 23:00:00 NaN India 1.0 0.0 0.0
611 2020-02-02 21:00:00 NaN India 2.0 0.0 0.0
675 2020-02-03 21:40:00 NaN India 3.0 0.0 0.0
745 2020-02-04 22:00:00 NaN India 3.0 0.0 0.0
815 2020-02-05 12:20:00 NaN India 3.0 0.0 0.0
885 2020-02-06 20:05:00 NaN India 3.0 0.0 0.0
958 2020-02-07 20:24:00 NaN India 3.0 0.0 0.0
1030 2020-02-08 23:04:00 NaN India 3.0 0.0 0.0
1102 2020-02-09 23:20:00 NaN India 3.0 0.0 0.0
1175 2020-02-10 19:30:00 NaN India 3.0 0.0 0.0
Country most affected
nCov_df.groupby(['Country']).Confirmed.max().reset_index().sort_values(['Confirmed'], ascending=False).head(20).plot(x='Country',
                                                                                                                      kind='bar', figsize=(12,6))

nCov_df.groupby(['Country']).Recovered.max().reset_index().sort_values(['Recovered'], ascending=False).head(20).plot(x='Country',
                                                                                                                      kind='bar', figsize=(12,6))

nCov_df.groupby(['Country']).Deaths.max().reset_index().sort_values(['Deaths'], ascending=False).head(20).plot(x='Country',
                                                                                                                      kind='bar', figsize=(12,6))

nCov_df[['Country', 'Deaths', 'Recovered']].groupby('Country').max().plot(kind='bar', figsize=(12, 7))

nCov_df[nCov_df['Country'] != 'China'][['Country', 'Deaths', 'Recovered']].groupby('Country').max().plot(kind='bar', figsize=(12, 7))

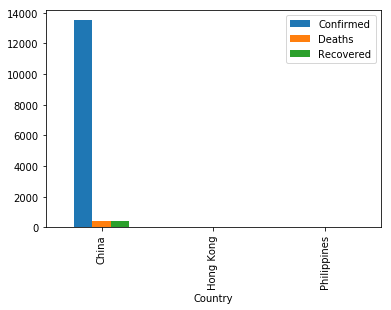
nCov_df[nCov_df['Country'] == 'Philippines'][['Country', 'Confirmed', 'Deaths', 'Recovered']].groupby('Country').max().plot(kind='bar')

nCov_df['Date'].min()

The result is,

Timestamp('2020-01-22 12:00:00')
When was the Virus Confirmed recently?
nCov_df['Date'].max()

The output is,

Timestamp('2020-02-10 19:30:00')
How many total no.of persons were identified with Virus on each day
nCov_df.groupby('Date')[['Confirmed', 'Deaths', 'Recovered']].max().reset_index()

The output is,

Date Confirmed Deaths Recovered
0 2020-01-22 12:00:00 444.0 0.0 0.0
1 2020-01-23 12:00:00 444.0 17.0 28.0
2 2020-01-24 12:00:00 549.0 24.0 31.0
3 2020-01-25 22:00:00 1052.0 52.0 42.0
4 2020-01-26 23:00:00 1423.0 76.0 44.0
5 2020-01-27 20:30:00 2714.0 100.0 47.0
6 2020-01-28 23:00:00 3554.0 125.0 80.0
7 2020-01-29 21:00:00 4586.0 162.0 90.0
8 2020-01-30 21:30:00 5806.0 204.0 116.0
9 2020-01-31 19:00:00 7153.0 249.0 169.0
10 2020-02-01 23:00:00 9074.0 294.0 215.0
11 2020-02-02 21:00:00 11177.0 350.0 295.0
12 2020-02-03 21:40:00 13522.0 414.0 396.0
13 2020-02-04 22:00:00 16678.0 479.0 522.0
14 2020-02-05 12:20:00 16678.0 479.0 538.0
15 2020-02-06 20:05:00 22112.0 618.0 817.0
16 2020-02-07 20:24:00 22112.0 618.0 867.0
17 2020-02-08 23:04:00 27100.0 780.0 1440.0
18 2020-02-09 23:20:00 29631.0 871.0 1795.0
19 2020-02-10 19:30:00 31728.0 974.0 2222.0
Case confirmed for each countries
nCov_df.groupby(['Country']).Confirmed.max().reset_index().plot(x='Country', kind='bar', figsize=(10,6))

Case confirmed other than China
nCov_df[nCov_df['Country'] != 'China'].groupby(['Country']).Confirmed.max().reset_index().plot(x='Country', kind='bar', figsize=(10,6))

nCov_df.groupby('Date')[['Confirmed', 'Deaths', 'Recovered']].max().reset_index().plot(x='Date',
                                                                                      y=['Confirmed', 'Deaths', 'Recovered'],
                                                                                      figsize=(12, 7))


nCov_df[nCov_df['Country'] == 'China'].groupby('Province/State')[['Confirmed']].count().reset_index().plot(x='Province/State',
                                                                                      y=['Confirmed'],kind='bar',
                                                                                      figsize=(12, 7))

nCov_df[nCov_df.Country == 'China'][['Province/State', 'Deaths', 'Recovered']].groupby('Province/State').max().plot(kind='bar',
                                                                                                                   figsize=(12, 7))

nCov_df[nCov_df['Recovered'] < nCov_df['Deaths']][['Country', 'Confirmed', 'Deaths', 'Recovered']].groupby('Country').max().plot(kind='bar')
nCov_df[(nCov_df['Recovered'] < nCov_df['Deaths'])&(nCov_df['Country'] != 'China')][['Country', 'Confirmed', 'Deaths', 'Recovered']].groupby('Country').max().plot(kind='bar',
figsize=(12,7))

Very slow recovery in china
nCov_df[(nCov_df['Country'] == 'China') & (nCov_df['Recovered'] == 0 )&( nCov_df['Deaths'] != 0)][['Province/State', 'Confirmed', 'Deaths', 'Recovered']].groupby('Province/State').max().plot(kind='bar',
figsize=(12, 7))

The data set and the source code of the post is attached here
https://github.com/RamaKavanan/Corono_Virus_Analysis
I hope this will help many of them. Please share valuable feedbacks.


Use this diet hack to drop 2 lb of fat in just 8 hours
ReplyDeleteAt least 160 thousand men and women are hacking their diet with a easy and SECRET "liquids hack" to burn 1-2 lbs every night while they sleep.
It's scientific and it works on anybody.
Here are the easy steps for this hack:
1) Go get a glass and fill it with water half full
2) And then learn this weight loss hack
you'll become 1-2 lbs lighter when you wake up!