Posts

Showing posts from 2018

Fix Ubuntu’s “switch to greeter” login bug
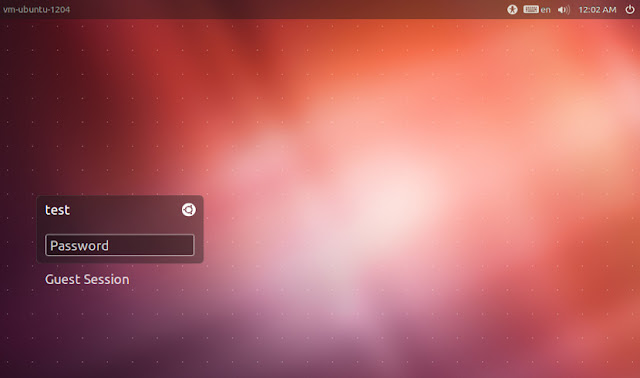
Image
One day I switched  to guest and returned back to the user account, The password box has the label information like ' switch to greeter' . When I looked at this I was shell shocked. After deep analysis I found that was OS issue. The issue related detail information given in this link      https://ubuntuforums.org/showthread.php?t=2363654  . This link helped me back to normal.  Solution :  LightDM  is the root cause of this issue. So we have to restart / reinstall the LightDM through the command line.  Before go to solution, the small introduction  of lightdm given below, What is LightDM? LightDM is the display manager running in Ubuntu up to version 16.04 LTS. While it has been replaced by GDM in later Ubuntu releases, LightDM is still used by default in the latest release of several Ubuntu flavors.  LightDM starts the X servers, user sessions and greeter (login screen). The default greeter in Ubuntu up to ...

Feature Scaling in Machine Learning using Python

Image
      In this tutorial we are going to learn how to do scaling the independent variable data using python. In data processing, it is also called as data normalization . What is the use of feature scaling in Machine Learning?      The range of values of raw data varies widely, in some machine learning algorithms, objective functions will not work properly without normalization. For example, the majority of classifiers calculate the distance between two points by the Euclidean distance . If one of the features has a broad range of values, the distance will be governed by this particular feature. Therefore, the range of all features should be normalized so that each feature contributes approximately proportionately to the final distance. Another reason why feature scaling is applied is that gradient descent converges much faster with feature scaling than without it. We can do the feature scaling in many ways. As of now we are going to look the Min-M...

Understand the relationship between two variable using Correlation

Image
It is important to discover the degree to which variables in your data-set are dependent upon each other. This will help us to prepare the good data-set to meet our machine learning algorithms expectation. Because if the data-set is not good then the performance will degrade. In this tutorial, we are going to discover the correlation statistical information of the relationship of two variable. After completing this tutorial you will know, How to calculate a covariance matrix to summarise the linear relationship between two or more variables How to calculate the Pearson’s correlation coefficient to summarise the linear relationship between two variables. How to calculate the Spearman’s correlation coefficient to summarise the monotonic relationship between two variables. What is correlation ? Variable in the data-set can be related each other in many reasons,For example One variable could cause or depend on the values of another variable One variable could be l...

Time Serious Forecast using Python

Image
Introduction:          Time series are one of the most common things encountered in daily life. For example Financial prices, weather , home energy usage, and even weight are all of data that can be collected at regular intervals. In the series collect the data points at constant interval time which leads the data have the dependency with the time . The Time series has the sudden increase or decrease in certain intervals(Month, day, hour ...). Which will implies the non stationary in the data modelling. The sudden increase we may called like trends , seasonality and so on. Data Analysis in Time series: In python, we have the great library Pandas to handle the time series objects, particularly the datatime64[ns] class which stores time information and allows us to perform some operations really fast. In the below example we are going to use the AirPassanger.csv data set. Initially, we have to load the necessary libraries import pandas as pd i...